simulation.africa

USE CASES / WHO WE WORK FOR

Your decision.
Modelled before you commit.

Each engagement starts from your real site and your real numbers, and ends with something you can act on: a design, a budget, a schedule or a maintenance plan you can defend to your board, your funder or your regulator.

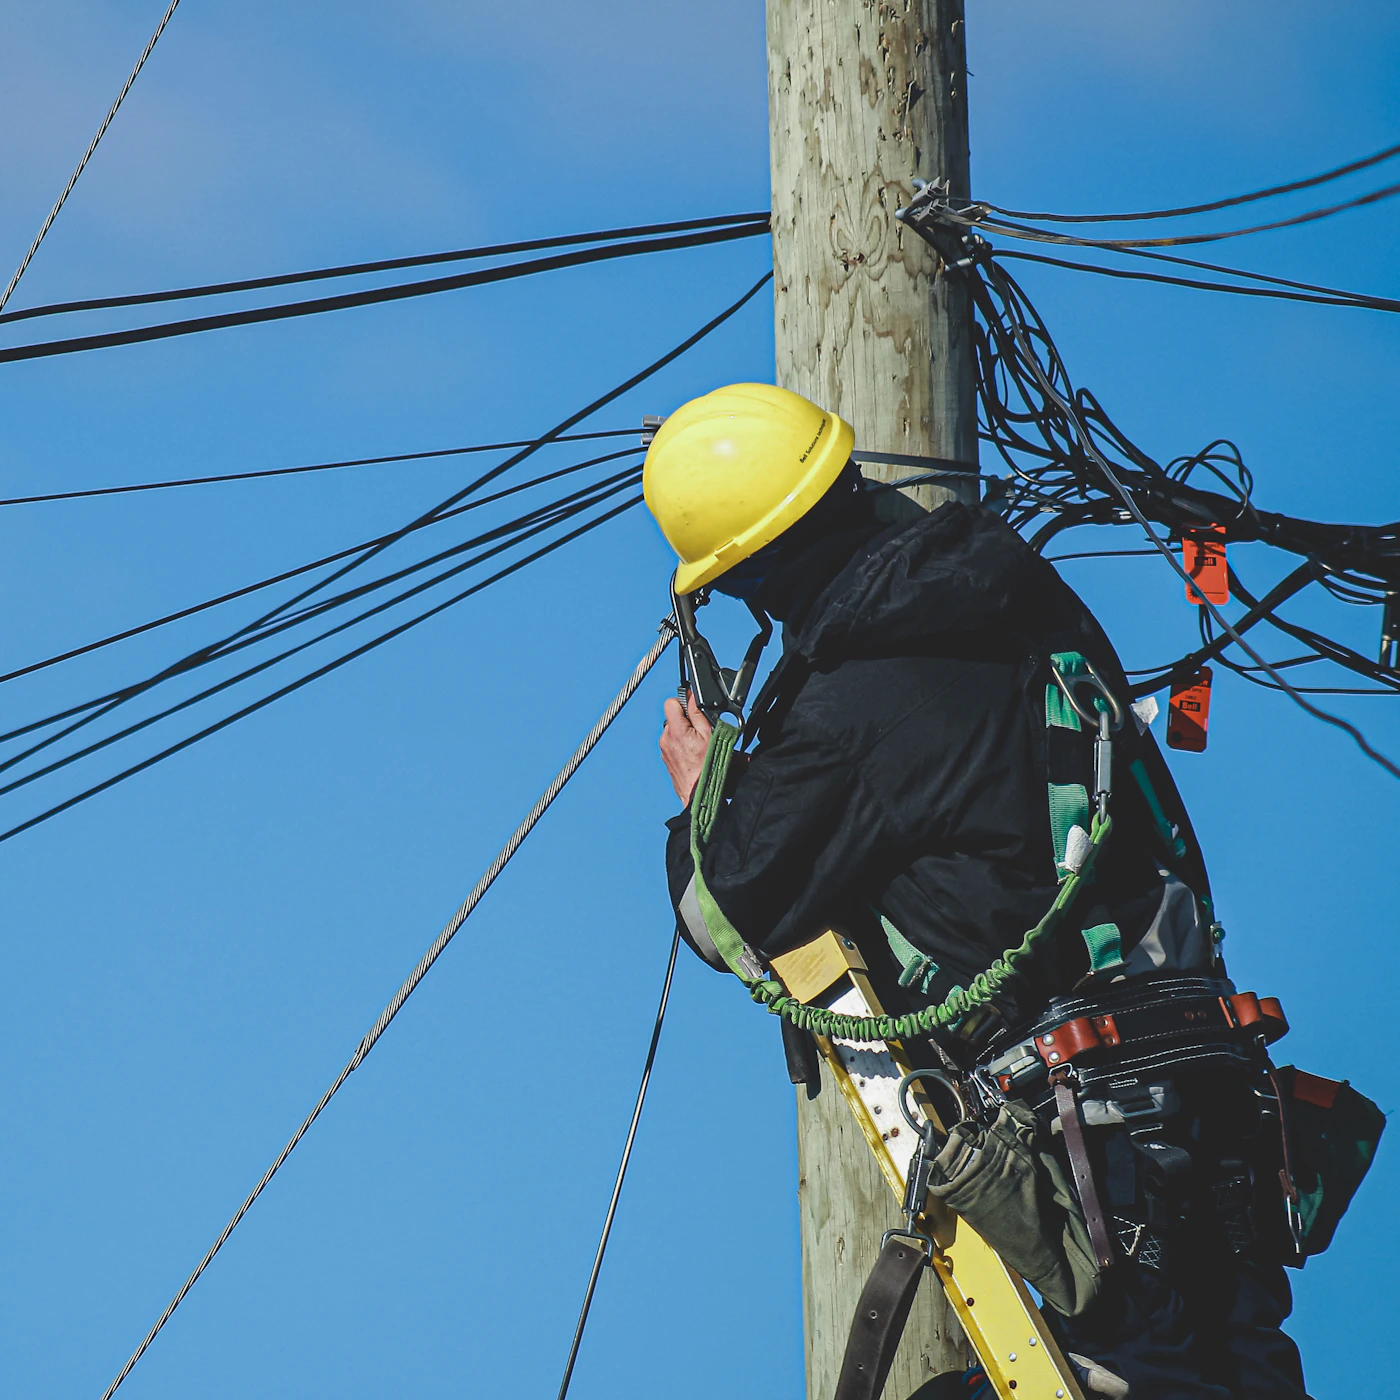
Line worker in a hard hat climbing a wooden utility pole
Photo: Compagnons / Unsplash

01 / NETWORKS & CONNECTIVITY

For network operators, ISPs and rollout contractors

How many crews do we need, and where should the fibre go?

Rollout budgets and repair targets are usually set in spreadsheets. The real constraints are in the ground: existing poles and ducts, travel times, and crews spread thin. We model your network and the teams who build and maintain it on the actual map.

What you get

  • Rollout route options on existing poles, ducts and plant, with quantities and cost for each
  • Crew numbers and territories sized to hit your installation and repair targets
  • Dispatch rules tested against a full year of faults, peaks included
  • A clear answer on when subcontracting pays, and where

Built on Data & context, Design & simulation, Telemetry & operations

Electric car charging at a home with solar panels on the roof
Photo: Christian Rebero Twahirwa / Unsplash

02 / ENERGY & CHARGING

For charge-point developers, fleet operators and property owners

How many chargers, and how much power, before you sign for the grid?

Too few bays and drivers queue, then leave. Too many and capital sits idle. We simulate arrivals hour by hour against the power you can actually get, including solar and storage, so the site is sized for the demand it will really see.

What you get

  • The number and rating of chargers each site needs
  • Queues and waiting times at peak, by hour and by season
  • Grid connection size, with solar and storage options compared
  • Utilisation and payback under low, expected and high demand
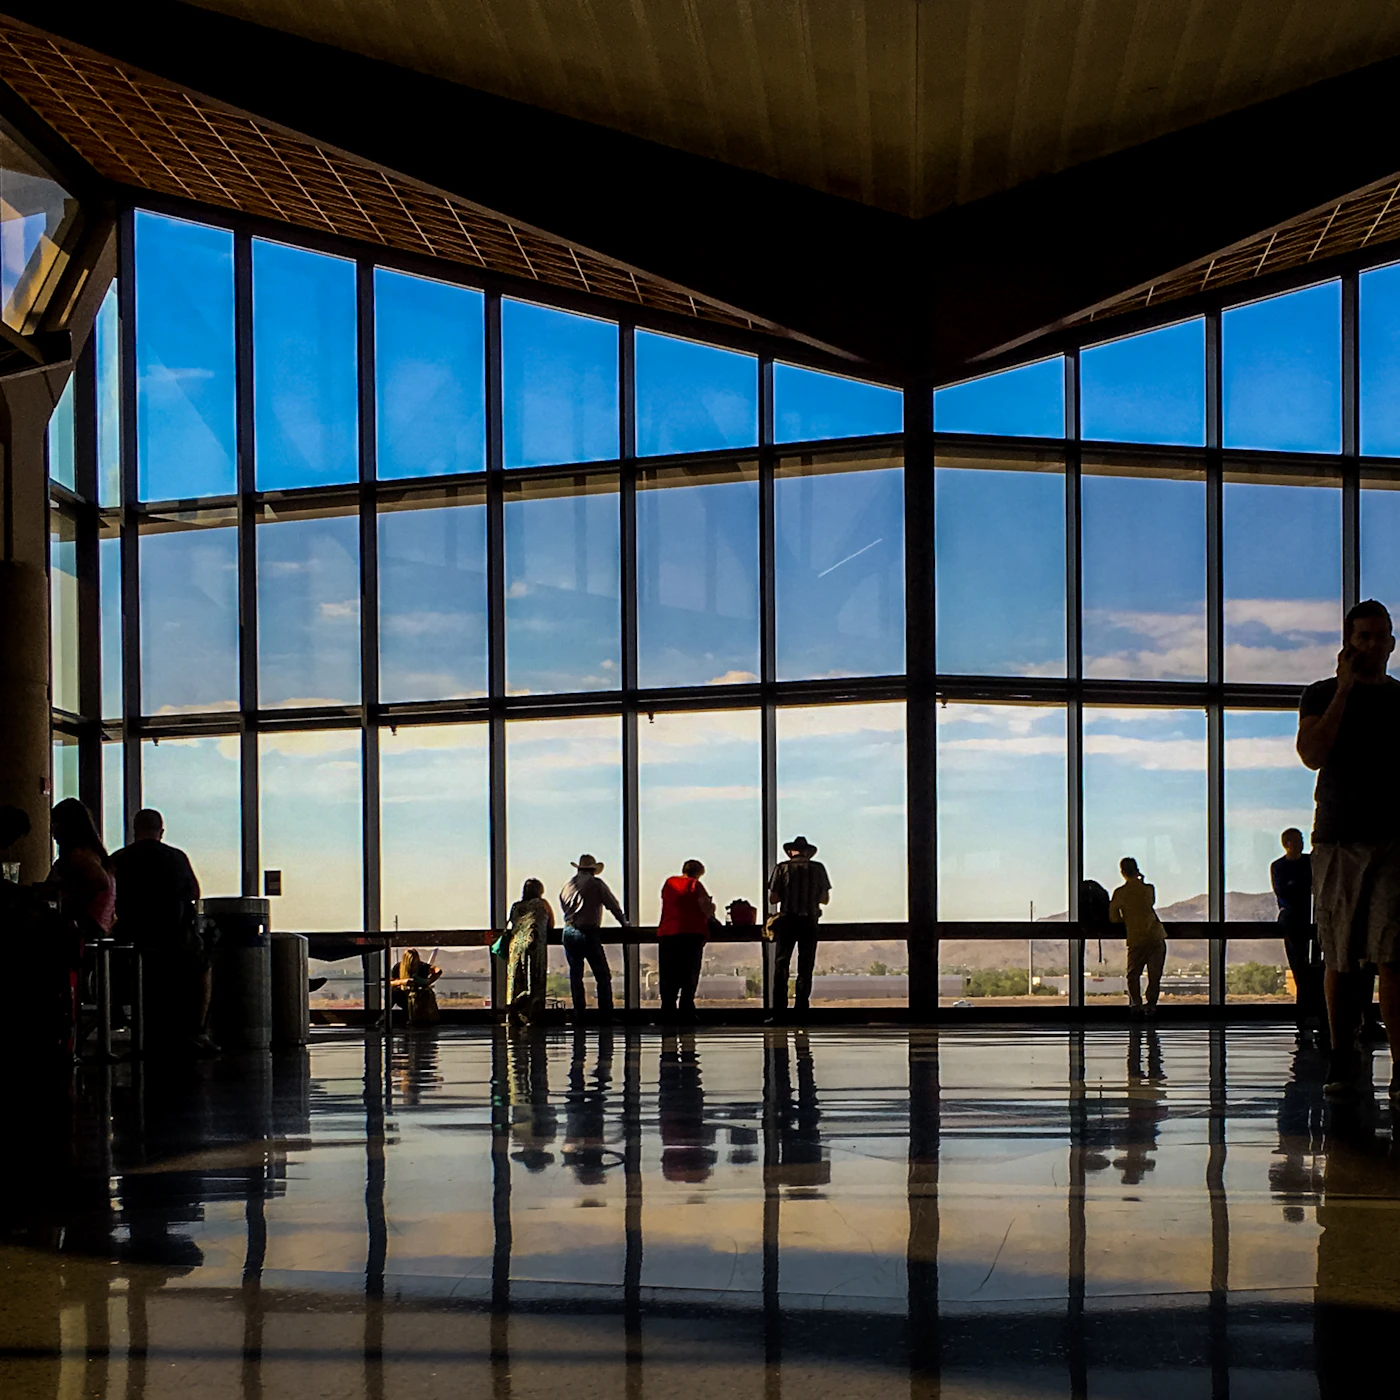
People moving through a large hall with tall windows
Photo: Paul Cuoco / Unsplash

03 / BUILDINGS & FACILITIES

For airports, hospitals, campuses, banks and service halls

Where will the queues form, and can you fix them before you build?

A building is judged at its busiest hour. We model how people arrive and move through entrances, counters, gates and corridors, so the pinch points show up while the layout can still change, not after opening day.

What you get

  • Peak-hour queue and waiting-time forecasts for each layout option
  • Counter, gate and staffing numbers by shift
  • Bottlenecks located on the drawings, with the fixes tested
  • Evidence you can put in front of a design review or a board

Built on Design & simulation, Diagnostics & redesign

Air-conditioning units on a building wall beside a red fire hose cabinet
Photo: Kien Nguyen / Unsplash

04 / BUILDING SYSTEMS & MAINTENANCE

For hotel groups, property managers and facility management contractors

Are your fire, HVAC and building systems safe, compliant and costing what they should?

Fire detection and alarms, sprinklers, HVAC, pumps, lifts and access control are what keep a hotel, apartment block or office open. We connect those systems to the drawings and maintenance records, automate the routine work and model the decisions that are not routine.

What you get

  • Planned maintenance and fire and life-safety inspections scheduled and tracked automatically, with an audit trail
  • Alarms and faults traced to the exact device, room and drawing
  • Early warning on HVAC performance and energy use, before equipment fails
  • Technician routes and response times across your whole portfolio
  • Retrofit and upgrade options tested before anything is installed

Designed to work alongside established building management and fire platforms, such as Honeywell, Siemens or Johnson Controls systems, rather than replace them. Simulation Africa is independent of these manufacturers.

Built on Data & context, Diagnostics & redesign, Telemetry & operations

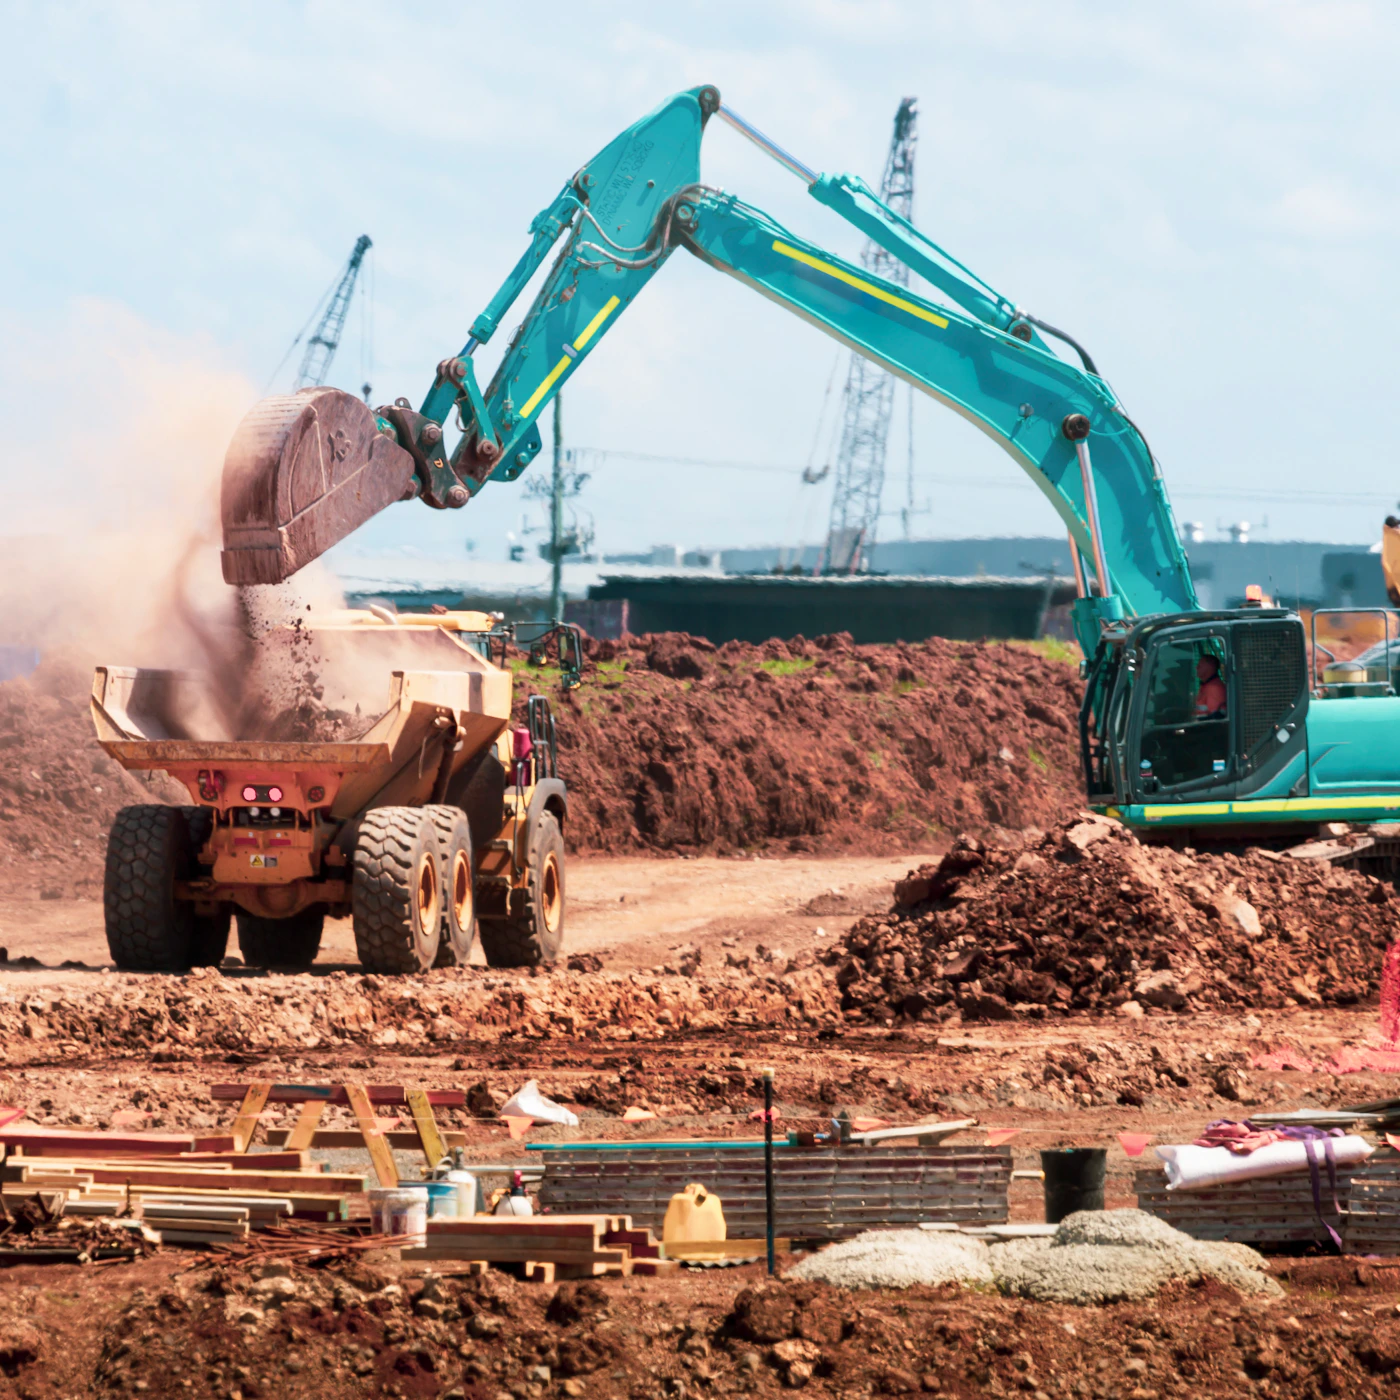
Excavator loading soil into a dump truck on a construction site
Photo: Troy Mortier / Unsplash

05 / SITE DELIVERY & MATERIALS

For contractors, developers and project owners

What will hold up the build, and what will a late delivery cost?

Delays usually start when materials, plant and crews arrive out of step. We link quantities and deliveries to the build sequence, so the bottleneck shows up on screen instead of on site.

What you get

  • Material quantities and delivery schedules for each work front
  • Plant and crew plans sequenced around the real constraint
  • Laydown and depot sizing
  • The cost and programme impact of a late delivery, before it happens

Built on Materials & costing, Design & simulation

HOW AN ENGAGEMENT WORKS

From your question
to a decision you can defend.

Every project is scoped around a decision with money attached. You see the assumptions, the model and the results, not just a recommendation.

01

Scope

A short call and a look at what you already have: drawings, GIS layers, asset registers, maintenance logs, building-system exports, spreadsheets. We agree the one decision the work must support.

DAY ONE
02

Model

We build a model of your real site or system, check it against your records, and test the options that matter to that decision.

YOUR DATA, YOUR SITE
03

Decide

You get the findings, the model and the numbers behind them, in a form your team can check, reuse and take to the board, the funder or the regulator.

EVIDENCE YOU CAN DEFEND

WHY SIMULATION AFRICA

Engineers first.
Software second.

Our work grows out of hands-on network planning and costing: fibre design and bills of materials, CAD-to-GIS data pipelines, and machine learning used on real field surveys. We know where the data is messy, where the assumptions hide and what a board needs to see before it signs.

See the expertise behind the work ↗

WHEN TO SIMULATE

The moments
a model earns its keep.

Simulation pays for itself when a decision is expensive, uncertain or contested.

01

Before committing capital

A route, a charging site or a building is far cheaper to change in a model than in the ground.

02

When demand is uneven

Peaks, seasons and growth expose limits that averages hide.

03

When many parts interact

People, equipment, rules and geography affect each other in ways a spreadsheet cannot show.

04

When targets keep slipping

Find the real constraint before deciding what to change.

05

When a change needs agreement

A shared model replaces opinion with evidence everyone can examine.

NOW TAKING ON PROJECTS

Start with your site.
Or your hardest problem.

Tell us what you want to design, automate, understand or improve. We’ll start with the challenge and the result you need.